This is a large group project I worked on at MICA! Lots of different topics here, including C++, Python, digital fabrication, and Internet of Things, among others.
Overview
MICAVIBE is a large group undertaking by the MICA Interactive Spaces class of 2019. The goal of the project is to design stations that collect data, and output it locally in a meaningful and interesting way. The stations are placed strategically around the MICA campus in order to get a feel for the “pulse” of the campus. Then we use the collected “pulse” data to generate 75,000 unique book covers for the MICA prospective student books!
The MICA Prospectus update was commissioned by the MICA Communications department, and the firm karlssonwilker was selected to take it on. Karlssonwilker’s proposal included the idea of unique bookcovers with generative artwork, and suggested that a class of MICA students take charge of collecting data around campus, since no one knows the campus better than the students. That’s where we came in!
During the course of this semester-long project, we were also filmed by a crew from Adobe for an upcoming highlight on young creatives. Exciting stuff! Hoping to get that footage back soon.
For collecting all of this data, we have a number of station designs, each tracking sound, mood, and motion. Read on to learn more, but note that this is a lengthy document! Making use of the table of contents is highly recommended :)
Station Designs
Sound
The sound stations are made from routed sheets of plexiglass that are sanded to get a more “frosty” appearance. Their brain is a Raspberry Pi, connected to two strands of DotStar LEDs. The lower strand displays sound in the immediate vicinity of the station, while the upper strand is a bit more complex…

Each station is receiving data from the other via Adafruit IO, and displaying it on its upper strand of LEDs, enabling a form of “communication” between the two. Note that each station is sending their data to an individual feed on Adafruit IO. This is for ease of identification and as to not overwhelm the data limit rate. Each station’s “waveform” is shown separately on the MICAVIBE website.
Motion
The motion station is a single sheet of plexiglass (sanded to the perfect frosted appearance) mounted on top of a matrix of DotStar LEDs. The camera at the top divides the current frame into segments, and assigns a “motion score” to each segment, depending on how much motion it has detected. It does this with a basic implementation of frame differencing.
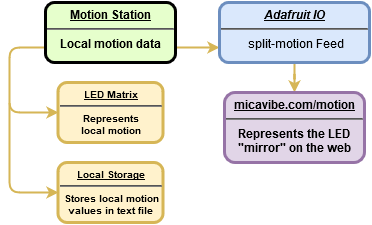
The motion station takes the motion values it assigns to segments of the frame it sees, and uses them to light up the LED matrix accordingly. It also sends the motion values to Adafruit IO for storage, and for use on the website, where it shows a web-based version of our LED matrix.
Mood
The mood stations are slightly different form factors (one is tall, the other is a petite little box), but both are made from the same routed and sanded plexiglass, and use the same set of buttons to collect inputs. They also include a DotStar strand to reflect the most recent input, and the tall one also includes a receipt printer to give the user a small memento!
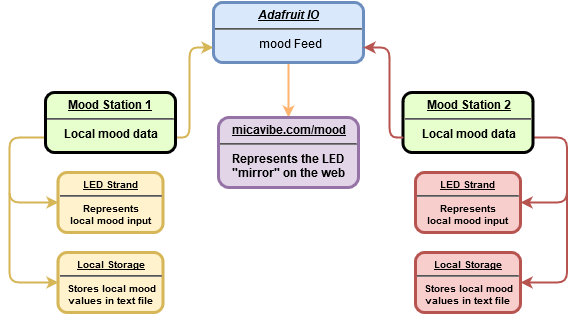
Unlike the sound stations, the mood stations both send their data to the same feed on Adafruit IO. We can still tell where each message came from, but we decided it was just easier to keep it on one feed, since the data limit rate wasn’t as much of a concern, given that data would only flow when humans pressed buttons on the stations (and we could limit how often messages were sent in case of someone spamming a button). The website pulls mood input data from Adafruit IO, and creates a bar graph of how often a certain color was sent and when.
Data Flow
The data collected by the stations is sent to and stored at Adafruit IO, an Internet-Of-Things data storage system created by Adafruit, a popular electronic components source for hobbyists, hackers, and DIY’ers. The stations that run on Raspberry Pi’s (nearly all of them) also store their data locally, in case of connection failure. For specifics on data I/O for each station, view the diagrams above.
Privacy and Data Ethics
Data ethics was something we discussed at length from the very beginning of this project. Our approach was to target collect data that was very nearly completely anonymous to begin with, and then abstract it and store it in a way that completely anonymizes any and all participants.
For instance, while our sound stations do have a microphone attached, they only collect local sound values in the form of a numerical value between 0 and roughly 10,000, that represents how loud it is in the immediate vicinity of the station. So we can get a kind of waveform that represents activity in that area at a certain time, but it is impossible to recreate what may have been said, as no actual recording of any kind is performed.
Similarly, the motion station has a camera that analyzes its surroundings for motion, but does not store any still images or video footage. Our code streams the live footage in frame by frame, analyzes each frame, gives a value to certain portions of the frame depending on movement, and then outputs those values in a long string, and lights up the LED “mirror” to give an abstracted representation of what is happening in front of it.
Personal Contributions
Our project also includes several heart-shaped indicator stations that track data input and output from the other stations. These are something that I personally put a lot of time into, so here’s a more in-depth breakdown of the design of them!
Heart Design
This is the design I made for the heart stations. While it was initially designed to be laser cut in slices, it was eventually 3D printed. The cavity in the middle is to hold the Feather Huzzah, and the slot around the perimeter is perfectly sized for a DotStar LED strip. We ended up printing 5 of these.
The DotStar strip has exactly 16 “pixels”, and the code splits it into 4 segments that represent different types of data.
Code
I wrote code for several parts of the different stations, both in Python and Arduino C++. I was also one of the team members responsible for deploying and maintaining code on our different devices running the stations, in our case, Raspberry Pis and Adafruit Feather Huzzahs (ESP8266)! Here’s a breakdown of the code for the hearts.
The code for the hearts was written in Arduino C++, as the hearts used the Feather Huzzah (the ESP8266 board) for a brain. We made use of the ESP8266Wifi library, the Adafruit DotStar library, and a slightly-modified version of Nick O’Leary’s PubSubClient.
We ran into an issue early on in development for the hearts code, as many of the libraries for communicating with Adafruit IO have a message limit of about 100 characters, and they will completely ignore any message that exceeds that limit. That meant that we were getting no response from the motion or sound stations (both of which regularly submit messages of about 140 characters). While we were able to modify the MQTT client library a little to allow us to respond to messages on the sound and motion feeds, they currently just pulse a segment of the DotStar strip when a message is received.
Messages from the mood feed however, are parsed through to pick out what color was selected. The buttons on the station correspond to a number 0 through 7, and that is what is sent to the feed when a button is pressed. There’s a simple series of checks for which number was received (in effect, which button was pressed), and the color of the mood segment of the heart is set accordingly.
Reflections
Challenges
This project was definitely complicated. It was one with many moving parts, multiple distinct interested parties overseeing the work, and sometimes a lack of clear distinction on who was responsible for what. While this is to be somewhat expected with such a large project, laying out and specifying in writing who is supposed to be delivering what would be a helpful step to take next time.
I think while it was a challenge to work as a team with other students who all come from different backgrounds and have very different skillsets, that’s very much real life, and it was a fantastic experience to coordinate working together to play to our strengths.
Next Steps
What’s next? While the project is currently installed on the second floor of the Dolphin Center, we will be installing for the Vigil, an all-night experimental sound art festival at MICA very soon.
The generative book cover code is already underway, and will likely be completed this summer.
For me personally, I’m hoping to take the experience I’ve gained in Arduino, Python, C++, web dev, and digital design/fabrication and make even more cool internet-connected gadgets and gizmos!
Source Code
Want to see our source code? All of our code is open-source and free to use. Check it all out below!